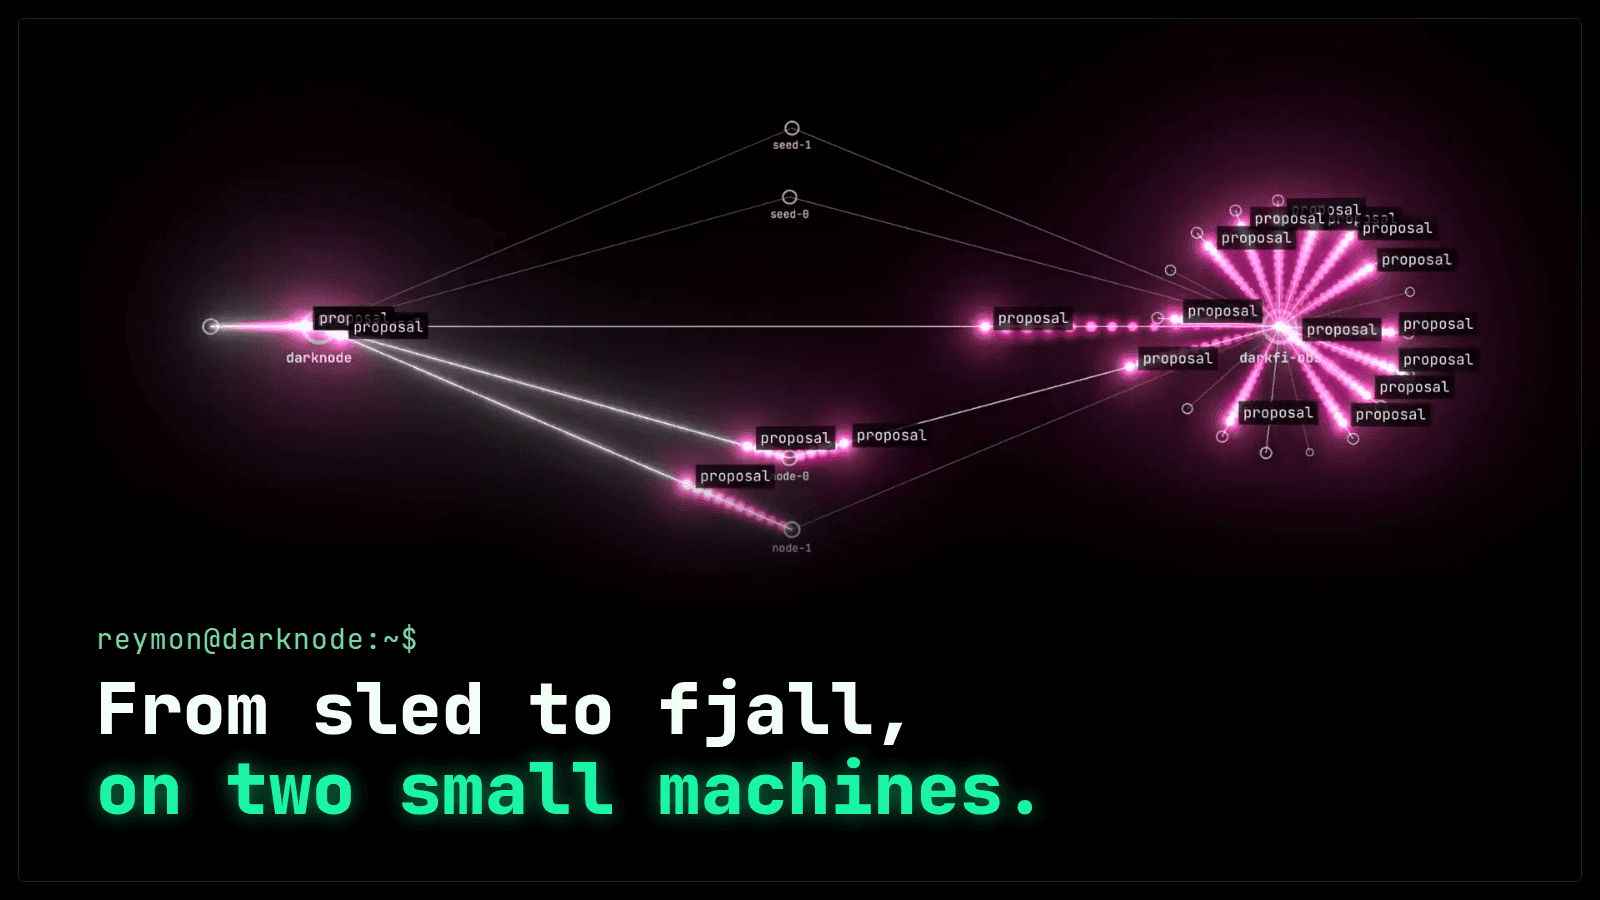
A Memory Budget on Two Small Machines: a DarkFi Node from sled to fjall
TL;DR: I run DarkFi testnet nodes on two small machines, a Raspberry Pi 5 with 8 GB at home and a rented server with 4 GB, and I have been profiling and testing things to understand memory behavior. Under sled, the embedded database the node used as its storage engine at the beginning, the node took almost all of whatever memory limit I gave it while I moved that limit between 3 G and 5 G. Under fjall, which replaced it, the same node on the same chain takes about half. A full sync under fjall takes 7 h 25 min on the Pi, and its peak lands in the four hundred blocks that carry almost half of the chain's transactions. On the 4 GB server that peak killed the node 5 runs out of 8 with the allocator it ships with. Capping glibc to a single arena takes about 800 MiB off the peak, and jemalloc survives 7 of 7 and is the only setting that gives the memory back. Both machines run jemalloc now. The collector, the panel and the benchmark rig are open source as darkscope.
Disclosure: I used an LLM as a pair through the instrumentation, the experiments and the editing. The diagnosis, the measurements and the verification are mine.
This is a follow-up to the node that killed its own host. That post ended with the node and the miner boxed into their cgroups on a Raspberry Pi. Since then the node changed its storage engine, from sled to fjall, I rented a second and smaller machine that joined the Pi in the network, and I built a tool to see both of them. This post is about the memory exploration of those couple of months, and the things I started analyzing and experimenting with in the network having two observers.
Contents
1. Two small machines
I am running two machines and both are intentionally small. The first is a Raspberry Pi 5 with 8 GB of RAM, an ARM board with an NVMe drive, at home, and it has been a DarkFi testnet node since June. It runs the node and a miner, and since both share the board, the node lives inside a memory limit.
The second one joined in September and it is the cheapest thing that could plausibly hold a node, a rented server with 4 GB in Helsinki at €6.64 a month. It was not for redundancy, but for complementing some of the analysis I was doing. The Pi has 8 GB and it works, and it even has space to run the miner, but I wanted to know how far down this goes. The new machine runs solely the node, with no memory limit at all. It also gives me a second place to watch the network from (there will probably be another post about this side).
| Raspberry Pi 5 | Rented server | |
|---|---|---|
| memory | 8 GB | 4 GB |
| what it is | ARM, NVMe, at home | x86, Helsinki, €6.64 a month |
| since | June | September |
| runs | node and miner | node only |
| memory limit | 4.2 G soft, 4.8 G hard | none |
I think running a node on small machines is interesting for two extra reasons. First of all, a network where being a peer needs expensive hardware or rented servers centralizes in second order, since the people who can afford those decide. As well, failures that only appear when a machine is short of memory, or short of disk, or behind a domestic router, have at least far fewer people looking at them, because protocols are usually built and tested on machines that have room.
Note: when I say the node holds memory I mean what its cgroup holds, and that has two sides. Anonymous memory, the heap and the stacks, is the part the kernel cannot take back from a process that has swap forbidden, and with MemorySwapMax=0 in the unit that is the situation of this node. The page cache is the other side and it is elastic: the kernel drops it when it needs the RAM and reads it back from disk later. The limits in this post are on the two together, and I say anon when I mean just the first.
2. Moving the limit
The first two months were about stopping the node from taking the machine down. Its memory grew until it starved everything else on the board, so I put it inside a memory limit, and it grew into the limit. I raised the limit and it grew into that one, and I lowered it and it shrank to fit: with the soft ceiling at 5 G the node settled at 4,630 MiB, and with it at 3 G at 3,327. A soft limit throttles and does not kill, which is why the memory can sit on the line and even a little over it.
The storage engine under the node in those months was sled 0.34.7, an embedded key-value store from 2021 whose last release is an alpha from October 2024. Its cache has no bound of its own beyond the ceiling it is given, which is what the figure shows, and it has two more failure modes that I also met on this board. A store that is in the middle of a write when systemd's stop timeout fires does not get to finish it, and after an unclean shutdown the node came up in a panic loop, 134 identical panics in serialization.rs:662, with no repair tool in that version, so the recovery was to throw away the index and the snapshots and let it rebuild from the blobs. I reported what I was seeing back then and the team told me they were already replacing sled.
3. From sled to fjall
Master moved from sled to fjall 3.1.9, through a small layer of their own called kvdb-overlay, on 17 August. My node kept running its July build in the meantime, because in those weeks I was just collecting its telemetry, and when I started measuring in earnest it took me a few days to see that the replacement had already landed, and I rebuilt.
I am showing it as a fraction because in those months I kept moving the limit, and the raw number moves with it. Under sled the node took 98% of whatever it was given, with a median of 3.44 G held. Under fjall it takes about half, 2.35 G, and it stops caring where the ceiling is.
What fjall is
darkfid does not talk to a database server. The database is a Rust library compiled inside the binary, its data is in files on disk, and its in-memory structures, the caches and the buffers, count as darkfid's memory, so what the database spends is counted as part of what the node spends.
fjall is an LSM-tree, a log-structured merge tree, and its memory follows from its write path, which has four pieces. Every write is first appended to a journal file, in order, because appending to the end of a file is the cheapest write there is and because that journal is what gets replayed after an unclean shutdown. The same write also goes into a sorted table in memory, the memtable, which is where reads look first, and which is anon (there is no file behind it). When a memtable reaches its maximum size it is sealed, written to disk as a sorted immutable file, and released from memory. Over time there are many of those files with overlapping keys and a background thread merges them into fewer, larger ones (that's what the merge in the name refers to). On the read side there is a block cache, chunks of those files kept in memory so that not every read goes to disk.
kvdb-overlay opens fjall on every default. The ones that matter for memory are the memtable size, 64 MiB per keyspace, and the absence of a global cap on the sum of all memtables. A keyspace is roughly a table: blocks, headers, transactions, and one tree per contract state, and darkfid opens 111 of them.
What a resync costs
Since I had a new binary, I needed to rebuild the chain from genesis under fjall, and it took 7 h 25 min on the Pi. We can split it into two different regimes:
| anon | how it holds | |
|---|---|---|
| at the tip, after a restart | 1,504 MiB | flat for two days, n = 36,945 samples |
| resyncing from genesis, default allocator | peak 4,733 MiB | the whole sync takes 7 h 25 min |
Anon rises in steps during the sync, with flat stretches in between, and the last step sets the peak. The log was full of lines about rotating journals, so I checked whether the steps were memtables being sealed by crossing the time of each rotation with the time of each memory jump, and of 18 rotation bursts only 3 land near a jump, so that seems not to be accounting for the steps.
The ceilings during that sync were 4.5 G soft and 5.2 G hard. When anon crossed the soft one the kernel (memory.high) reclaimed the cache from the cgroup first, and when that was not enough it started sleeping the threads that asked for memory. The high counter in memory.events went past 926,000, the sync fell from 160 to 185 blocks a minute to one or two, and the node kept answering, because memory.high just throttles (memory.max is the one that kills). The link between the ceiling and the slowdown is inferred, because this kernel ships without pressure stall information and I could not read memory pressure directly; what I did see is that raising the ceiling live brought the rate back.
The Pi also rebooted hot twice that week. Under sled that was gambling the database. But for fjall the log said it was recovering each keyspace's tree, and 28 seconds after starting it reported the blockchain synced, which is the journal explained above being replayed. Note: that's just two cases, not a statistically meaningful sample size.
4. The allocator
Besides the memory sampler, the block logger gave me some additional information. The testnet is quite empty: across the whole chain the count is flat at one call per block, the miner's reward, and it rises from blocks 64,400 to 64,800, with 1,022 contract calls, the two busiest two-hundred-block buckets on the chain, the next busiest being 244. On the Pi, under the default allocator, anon climbs in steps to about 3.3 GB, sits there from about block 54,000, and then goes to its 4,733 MiB peak within those four hundred blocks. On the 4 GB server that region is where the node died: at 89% of a sync from genesis, block 64,560 of 72,436 at that moment, with 3,542,924 kB of anon on the OOM killer's line, after the previous 64,000 blocks with anon flat at 2.6 GiB. So the budget that decides whether the hardware is enough lies in those four hundred blocks.
After the sync, at the tip, the Pi was holding 4,411 MiB of anon. After a restart at the same height it worked flat on 1,504 MiB and stayed there for two days. So the working set at the tip is about 1.5 GiB and everything above that line is retention, memory the sync asked for, stopped using and never gave back, roughly 2.9 GiB of it.
Tracing this back we end up in between the program and the kernel, and we look at the allocator. When Rust code frees something the chunk goes back to the allocator's own store, not to the kernel. The kernel only sees anon go down when the allocator decides to hand a region back. darkfid uses glibc's malloc by default, because it declares no allocator of its own and that is Rust's default on Linux. Two properties of glibc's malloc describe the behavior I mention above. It keeps up to eight arenas per core, independent regions so that threads do not collide when they allocate, 16 on the two-core server and up to 32 on the four-core Pi, and darkfid's 14 threads spread across them, so what one thread frees is retained in that thread's arena and is not available to the others. And it does not give pages back: freed chunks stay in the free lists to be reused, the heap is only trimmed at its end, and only very large reservations are returned whole. On the other hand, jemalloc is another allocator with the same job but with a different strategy. It groups reservations into size classes, which fragments less, and it returns pages to the kernel after they have gone unused for a while.
DarkFi's own chat daemon, darkirc, has run jemalloc since 8 July, but at the time of writing darkfid does not, so I spun up some experiments to measure it. The first was an A/B on both machines, the same sync twice with the allocator switched by LD_PRELOAD=libjemalloc.so.2 in a systemd drop-in, which works because darkfid is dynamically linked, so nothing is recompiled. On the Pi the two runs were full syncs from genesis:
| Raspberry Pi 5, 8 GB | glibc | jemalloc |
|---|---|---|
| peak anon | 4,733 MiB | 3,685 MiB |
| the soft ceiling | crossed, about 926,000 throttle events | never crossed, 3,195 |
| blocks a minute through the dense stretch | 1 to 2, throttled | 9, and 195 on leaving it |
That last row shows that the run that never crosses its ceiling is never throttled. On the server, where these runs had no ceiling at all, the same stretch took 821 to 841 s under glibc against 681 under jemalloc, which is 19% faster.
Then I kept going on the VPS server, because glibc against jemalloc mixes two things: how high the memory goes, which decides whether a small machine survives, and whether it ever comes back, which decides what the node holds for the rest of its life. glibc has a knob for the first one, MALLOC_ARENA_MAX, an environment variable that caps the number of arenas. I ran the same 400 blocks under four settings, and then three more arms on 29 September, 21 runs in all counting the Pi's two. Except for one, every run on the server started from a restored snapshot of the same database at block 64,566, so each one was meeting an identical starting state. The exception is the first, which synced from genesis over five hours and is the run of the OOM line above.
| Setting | peak anon | holds afterwards | median | wall | outcome |
|---|---|---|---|---|---|
| glibc, as shipped | 3,235 to 3,364 MiB | 2,199 to 2,564 | killed, 4 runs of 7 | ||
MALLOC_ARENA_MAX=2 |
3,193 | 3,043 | 2,550 | 921 s | survived |
MALLOC_ARENA_MAX=1 |
2,555 to 2,595 | 2,481 | 1,899 | 981 to 1,021 s | survived, 3 of 3 |
| jemalloc | 2,392 to 2,493 | 874 | 1,187 | 681 to 781 s | survived, 5 of 5 |
Capping glibc to one arena takes about 800 MiB off the peak and turns four deaths in seven into none in three, and the three single-arena runs came out at 2,595, 2,555 and 2,560 MiB of peak, with a median of 1,899 in all three. Capping to two changes almost nothing, 3,193 against 3,235 to 3,364, because two arenas still fragment. The page cache tells the same story from the other side: at the peak the dying default had between 1 and 53 MiB of cache left, and the survivors had 621 to 746.
Single-arena glibc still ends holding 2,481 MiB after the work is done, barely below its peak, and jemalloc ends at 874. In the trace jemalloc climbs to its peak and comes back down within a minute, 3,685 then 2,664 then 2,314 MiB on the Pi, but every glibc setting goes up and stays up until the process restarts.
The single arena still pays a price in terms of time, since it is the slowest arm, 981 to 1,021 s through the stretch against jemalloc's 681 to 781, and it is not waiting on anything in particular, it just burns 981 CPU-seconds for 1,002 of wall, where jemalloc burns 727 for 781, so one arena makes the allocator do about a third more work. The environment variable makes the memory part better but pays a fee of around 25% in time. jemalloc, on the other hand, improves both.
Tuning jemalloc, and checking where the time goes
jemalloc can also be tuned, for example in how long it keeps a freed page before it returns it to the kernel. On 29 September the server ran the stretch three more times from the same snapshot: glibc as shipped, jemalloc as it comes, and then jemalloc with MALLOC_CONF=background_thread:true,dirty_decay_ms:0,muzzy_decay_ms:0, which tells it to return pages at once and to do it from a background thread. This time I ran a second sampler alongside the memory one, reading the cgroup's CPU time, its I/O pressure and the process' disk and network counters every five seconds, so the arms could be compared per block.
29 September, darkfid 0.5.0 |
outcome | time | blocks | ms per block | peak anon | holds afterwards |
|---|---|---|---|---|---|---|
| glibc, as shipped | killed at 64,721 | 481 s | 163 | 2,951 | 3,101 MiB | |
| jemalloc | survived | 669 s | 477 | 1,403 | 2,388 | 898 |
| jemalloc, decay tuned | survived | 725 s | 437 | 1,659 | 2,351 | 841 |
Tuning did not do much. Returning pages immediately translates into 37 MiB off the peak and 18% more time per block, so jemalloc as it comes was the best of the three and there is nothing to add to the LD_PRELOAD line. However, these are just three points in a large space, and I haven't covered much of it.
The sampler also tells where the wall clock goes:
| glibc | jemalloc | jemalloc tuned | |
|---|---|---|---|
| CPU busy, 2 cores | 49% | 53% | 54% |
| stalled on block I/O | 8.5% of wall | 5.0% | 4.1% |
| received per block | 58 KiB | 32 KiB | 35 KiB |
| written per block | 5.8 MiB | 7.1 MiB | 7.7 MiB |
The node is not waiting on the network or on disk. The stall row is the share of the wall clock during which some task in the cgroup was blocked on the block layer, which is an upper bound on what the disk costs. The rest is computing. For those 32 KiB in, the process writes about 7 MiB to disk per block, about 230 times what it received. The node's journal tells where the computing goes, because it stamps every phase of a contract call in microseconds. Starting the WASM runtime is 52% of one: 66.9 ms of a 129 ms PoWRewardV1 call, over 14,048 of them, because the module is compiled again on every call, so a sync from genesis compiles the same contract 73,038 times. I patched a throwaway branch to keep the compiled module, caching the pair of engine and module (per contract) because wasmer's metering middleware holds per-module state and panics if one engine serves two modules:
static MODULE_CACHE: OnceLock<Mutex<BTreeMap<Vec<u8>, (wasmer::Engine, Module)>>> =
    OnceLock::new();

fn engine_and_module(wasm_bytes: &[u8]) -> Result<(wasmer::Engine, Module)> {
    let compile = || -> Result<(wasmer::Engine, Module)> {
        let engine = new_engine();
        let store = Store::new(engine.clone());
        let module = Module::new(&store, wasm_bytes)?;
        Ok((engine, module))
    };
    let cache = MODULE_CACHE.get_or_init(|| Mutex::new(BTreeMap::new()));
    if let Some(pair) = cache.lock().get(wasm_bytes) {
        return Ok(pair.clone());
    }
    let pair = compile()?;
    cache.lock().insert(wasm_bytes.to_vec(), pair.clone());
    Ok(pair)
}
The key is the contract's wasm bytes, because contracts get redeployed, 31 times in this chain's history, and the bytes are the identity. Over the same stretch, same binary, same allocator:
| wall | per call | peak anon | holds afterwards | |
|---|---|---|---|---|
| compile on every call | 821 s | 121.2 ms | 2,418 MiB | 913 |
| keep the module | 661 s | 61.6 ms | 2,463 | 957 |
| keep it and compile with Cranelift | 742 s | 55.2 ms | 2,819 | 950 |
Keeping the module takes 19.5% off the wall clock of the stretch and about half off a call, for about 45 MiB of memory. Cranelift, an optimising compiler in place of Singlepass, buys 6 ms more per call for 356 MiB of peak, not worth it for a node whose whole problem is memory constraints. Also, Singlepass is deterministic by design, which a validator needs. What the patch does not exercise is invalidation: a redeployed contract is different bytes and therefore a different key, which should be correct and did not run inside this window. The measurement went to the developers, and the cache was already being done upstream by one of them, so probably when you are reading this, this is just a small anecdote about my measurements. The patch is bench/module-cache.patch in the repository.
Note: the runs do not clear fjall. The allocator holds what something else allocated, and 111 uncapped memtables are still the most likely source of the allocations themselves. The jemalloc numbers at the tip have hours behind them and not days, so they are not a steady state. And every arm met the same transactions, so the only thing that changes between them is who held the memory afterwards. And the counts are small: across both series glibc as shipped died in 5 of 8 runs, one arena survived 3 of 3, two arenas 1 of 1 and jemalloc 7 of 7 counting the tuned one, and the run logs and the raw series are in the repository.
The team told me jemalloc in darkirc had been an experiment about a different problem, the RAM that RLN uses, and nobody had looked at what it does to a sync. I shared my benchmarks, memory and processing speed on both machines, and the scripts and the raw series are in darkscope, under bench/.
5. What I run now
memory.high is compared against memory.current, which is anon plus page cache. The ceiling is how much heap and cache together you allow, and it cannot be set near the working set. At 3 G with 2.2 G of anon, the cgroup would be left with 0.8 G of cache and would live in constant reclaim: the kernel keeps throwing the cache away to stay under the line, every read goes to disk, the same failure that crushed this Pi's cache to zero in September. high has to sit above anon plus a healthy cache.
From the numbers above I run two profiles rather than one, because a node at the tip and a node resyncing are two different regimes and one ceiling cannot serve both.
| Profile | MemoryHigh / MemoryMax |
miner | when |
|---|---|---|---|
| tip | 4.2 G / 4.8 G | on | day to day |
| resync | 4.5 G / 5.2 G | off | rebuilding from genesis |
high at 4.2 G leaves about 2 G of cache on top of the working set and only throttles during a deep catch-up. max at 4.8 G sits 1.1 G above the worst peak I have measured under jemalloc, which is the margin for a burst of transactions, and max is the one that kills. With the miner at its own 2.5 G ceiling the realistic sum is about 6.0 G of the board's 7.87, and in the pathological case, a deep catch-up while mining, the cache goes to nearly zero but nothing is killed. If a full resync from genesis is ever needed, the miner stops and the resync profile goes in.
Both machines run jemalloc now, through LD_PRELOAD in the unit. On 2 October the Pi, at the tip, holds 2.29 G in its cgroup, anon and cache together, under the 4.2 G and 4.8 G of the tip profile. The 4 GB server runs with no cgroup ceiling at all and holds 2.16 G of its 3.7 G of RAM. For someone who cannot preload a library, MALLOC_ARENA_MAX=1 in the unit's environment can buy the peak for about a quarter of the sync time, and it does not return the memory anyway.
The node runs with MemorySwapMax=0 for now. Advice I got from the developers was that a constrained node without swap is not ideal, but I keep it at zero while I measure, because swap would hide a bit of what I am measuring: retained allocator memory is untouched anonymous pages, which are the first thing the kernel evicts, so with swap on the 2.9 GiB of retention would have gone quietly to disk and the node would have looked healthy. Once the measuring is over the plan is compressed swap in RAM and a bounded MemorySwapMax in place of zero, tested against the current zero on the same snapshot.
So the impact on memory comes mainly from the sync process, not from the everyday tip regime. A node that is up to date fits in 8 GB with room for the miner. A node catching up does not always, and every reboot is a small catch-up, so the peak of the resync is the number that decides whether the machine holds it.
6. darkscope
Everything in this post was measured with one open tool. darkscope has three parts: a collector that runs next to each node and reads what the node already reports, a server that receives from every collector, and a panel that is a pure receiver and draws as much as it receives (it plots multiple machines). The panel is the same one that runs at reymom.xyz/darknode/live.
git clone https://github.com/reymom/darkscope && cd darkscope && ./install.sh
# then open http://localhost:8080
There is no account and no service behind it. It runs on the machine that runs the node and the data stays there, and the panel is committed built, so cloning it needs no npm.
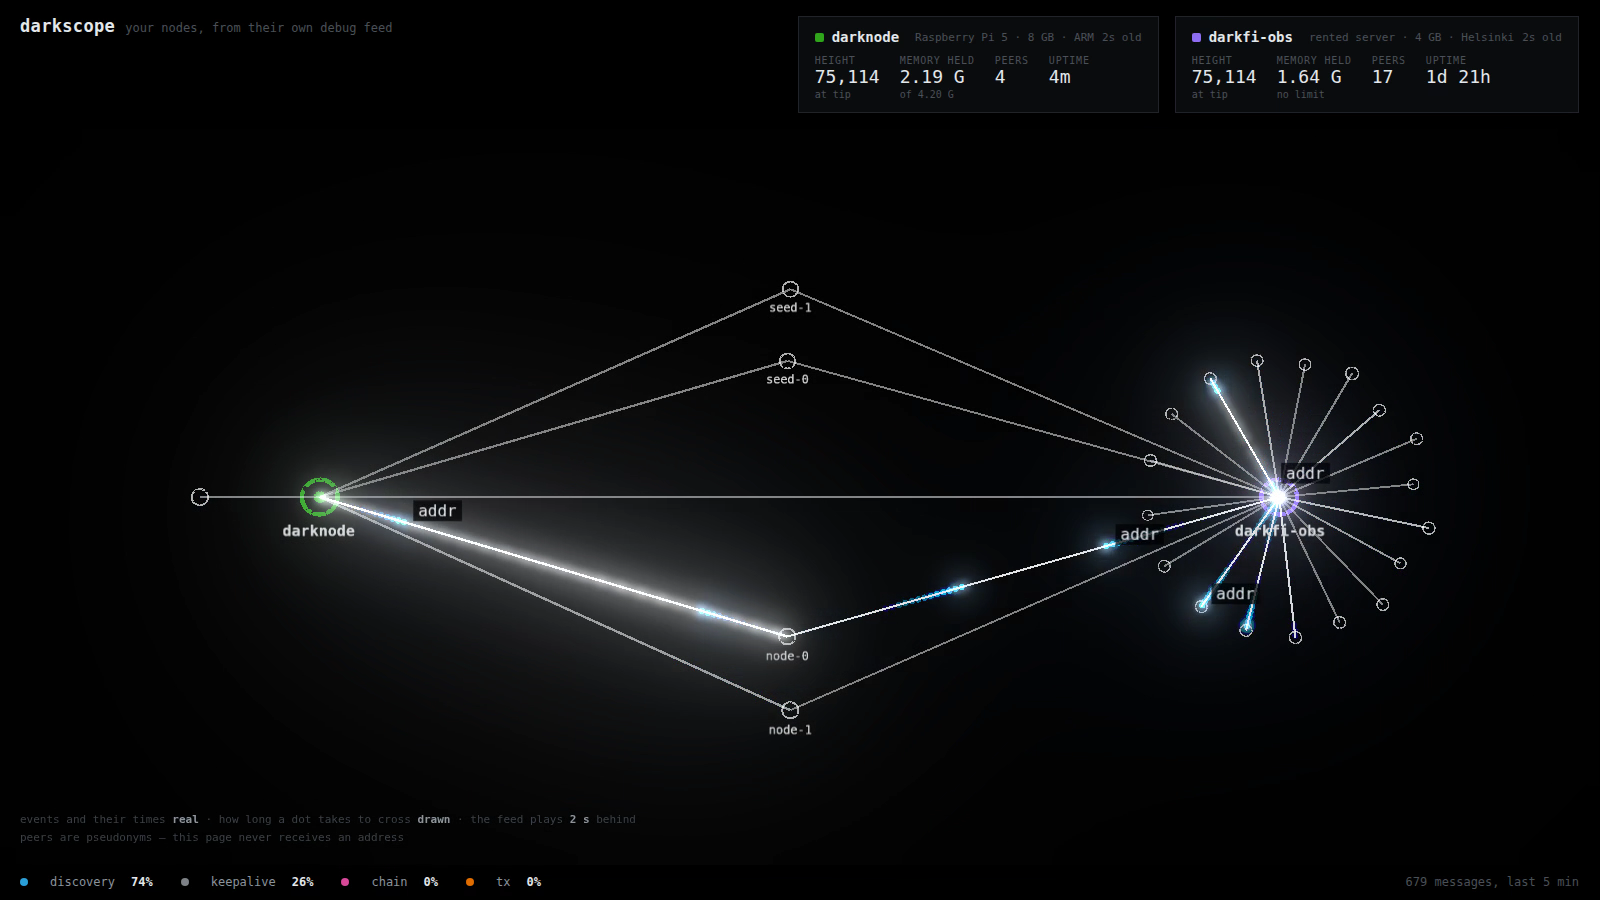
The bench/ directory is the rig behind section 4. It restores the same chain database, changes one environment variable, records whether the node survives the four hundred blocks that carry the transactions and samples where its time goes, and the raw series of the runs are in bench/results/, with the module cache patch next to them. It also refuses to start while another systemd drop-in is in force, because a control arm that runs with a leftover LD_PRELOAD reports jemalloc's numbers under glibc's name (which happened once before that check existed). The tool's threat model is in the repository, in docs/THREAT-MODEL.md: what each of the three parts trusts, what crosses each boundary and what is untested.
Measurements more on the network side, from runs measured from the same two machines, might be accounted for in a future post.
In two days I am giving a talk at DARK Prague about the things discussed in this post. My teammate elespectator and I will also be at a booth in the Project Hub, showing the node and the panels it generates in person. The Pi travelled to Prague unplugged, came back up on a phone hotspot, and resynced. As of publishing it is at the tip, holding 1,505 MiB of anon against the 1,504 MiB working set measured over two days in September.
References
- Part one, a DarkFi node on a Raspberry Pi
- Part two, the node that killed its own host
- darkscope, the collector, the panel and the benchmark rig: https://github.com/reymom/darkscope
- fjall, an LSM-based embedded key-value store in Rust: https://github.com/fjall-rs/fjall
- sled: https://github.com/spacejam/sled
- jemalloc: https://jemalloc.net/
- glibc malloc internals (arenas, free lists, trimming): https://sourceware.org/glibc/wiki/MallocInternals
- Kernel cgroup v2 memory interface (
memory.high,memory.max,memory.events): https://docs.kernel.org/admin-guide/cgroup-v2.html#memory-interface-files - systemd resource control: https://www.freedesktop.org/software/systemd/man/latest/systemd.resource-control.html
- DarkFi Book, Running a Node: https://dark.fi/book/testnet/node.html
# related
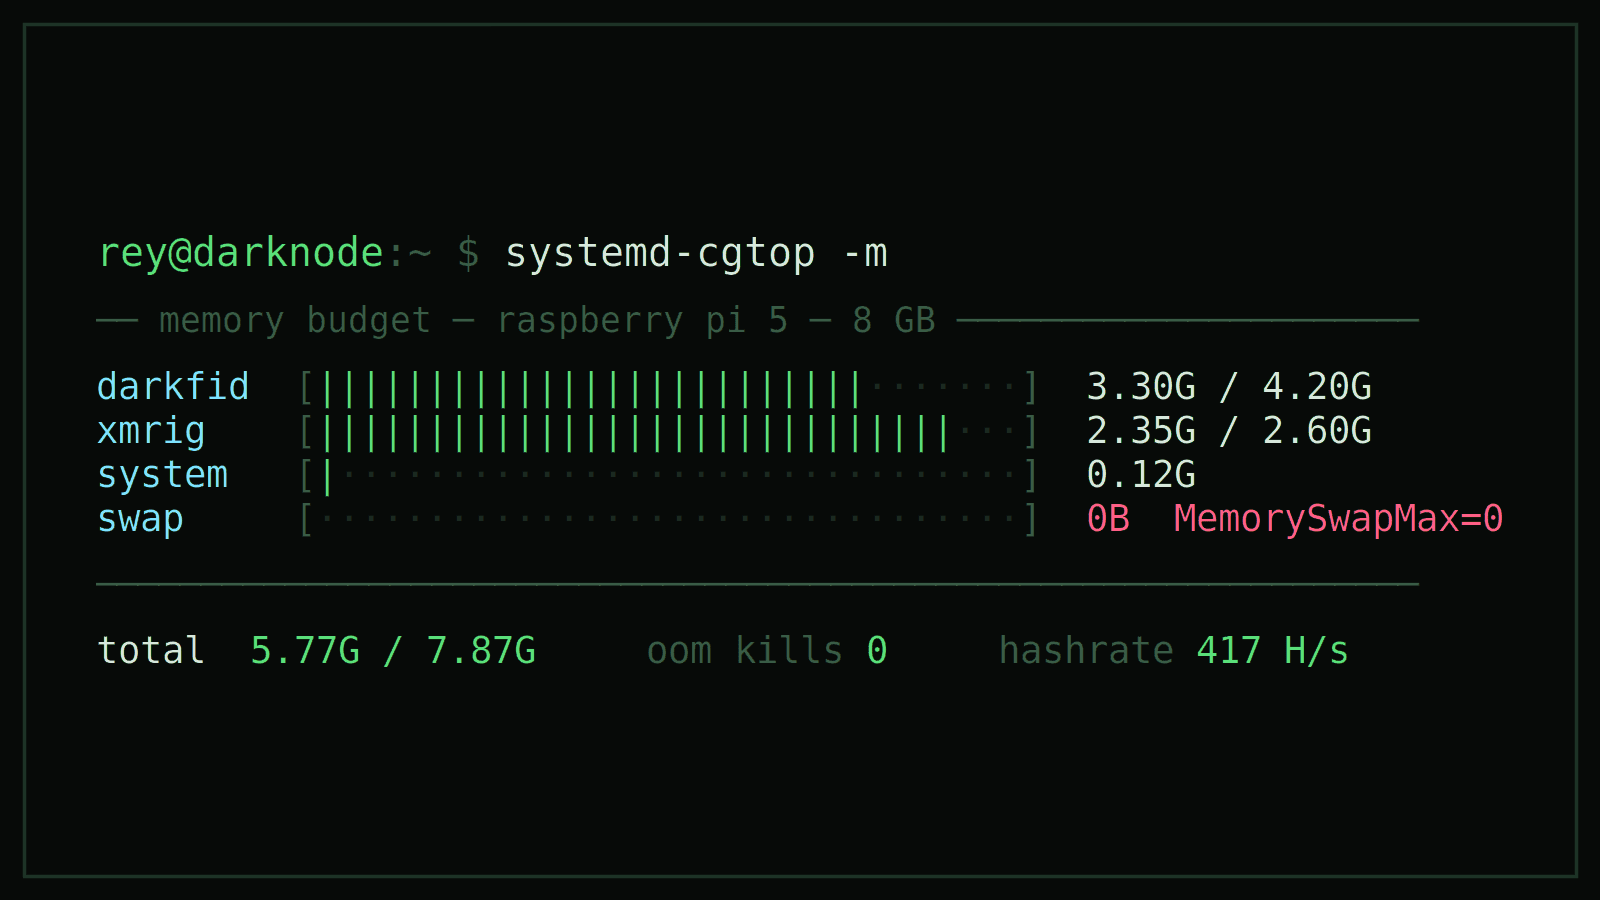
The Node That Killed Its Own Host — cgroups, Sled, and a 2.3 GB Miner on 8 GB of RAM
Part two of the DarkFi Pi: the node grew to 4.5 GB and was taking the host down with it. Notes on why the memory limits I wrote were ignored, why swap made it worse, how the OOM fight corrupted the database, and what a RandomX miner really costs.
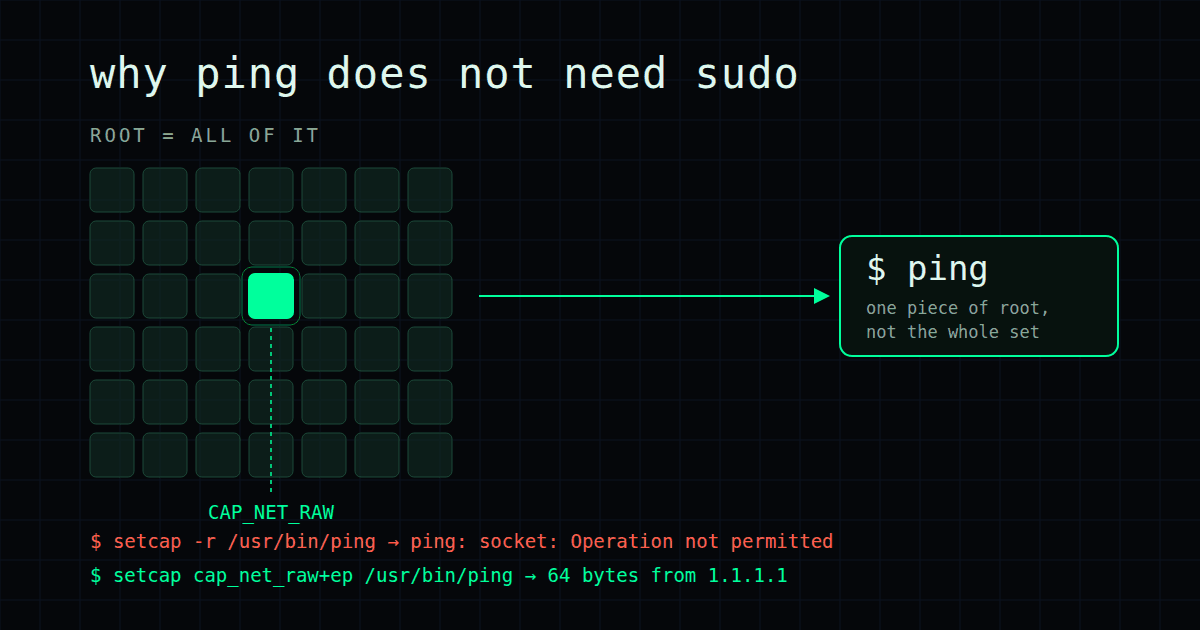
Study notes on Linux fundamentals: setuid and capabilities with ping
As the first part of this series of study notes, I am exploring a very simple concept: why ping does not need sudo, what capabilities are and why they are a fundamental feature in Linux.
A DarkFi Node on a Raspberry Pi — ARM Bring-Up Notes and the Circuits Underneath
Notes from turning a Raspberry Pi 5 into a 24/7 DarkFi testnet node and miner: NVMe boot, self-hosted WireGuard, the ARM dependency trail for darkfid and xmrig, and a look at the ZK circuits the node deploys on startup — including the v3a exploit that sat on a Poseidon binding.